What a patient monitor measures and how
Understand the measuring principle of each monitor parameter - ECG, SpO2, NIBP, IBP, temperature and CO2 - well enough to know what a simulator can and cannot prove, and where each channel usually fails.
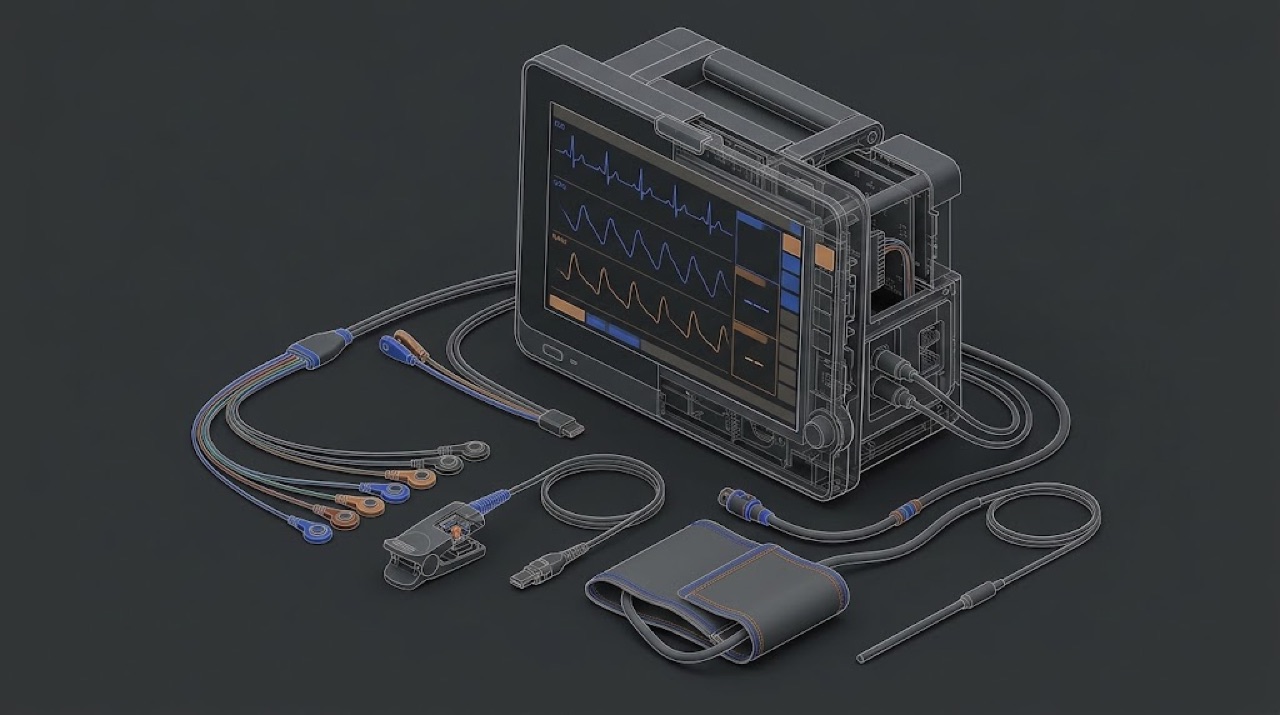
One box, six independent instruments
A multiparameter monitor looks like one device, but for a service engineer it is better thought of as several separate measuring instruments that share a screen, a power supply, an alarm system and a network connection. The ECG channel has nothing in common with the NIBP pump. The SpO2 module does not know the CO2 module exists. Each has its own front end, its own accessory, its own way of failing and its own way of being tested.
This is the most useful idea in the whole course. When a nurse says 'the monitor is broken', it is almost never the monitor. It is one channel, and most often the accessory of that channel: an ECG lead wire, an SpO2 sensor, a cuff, a sampling line. The physics in this lesson is not here to make you a clinician. It is here so that, for every channel, you know three things: what physical quantity is really measured, what the monitor calculates from it, and which of those two steps your test equipment actually checks.
That third point matters more than it seems. Some channels can be checked absolutely: a calibrated manometer tells you exactly whether the NIBP transducer reads pressure correctly. Other channels can only be checked for consistency: a simulator tells you that the module follows its own algorithm, not that the algorithm is right for a real patient. Knowing the difference keeps you from writing claims in a service report that your measurement does not support.
ECG: millivolts through a differential amplifier
The heart produces electrical potentials that reach the skin at the level of roughly one millivolt for the QRS complex. The patient's body, meanwhile, picks up mains interference that can be far larger, and it is the same on all electrodes. The ECG front end therefore uses a differential amplifier: it amplifies the difference between electrodes and rejects what is common to them. How well it does this is its common-mode rejection. Most designs also drive a small correction signal back into the patient through one electrode (the right-leg or neutral electrode) to reduce the common-mode voltage further.
Around this amplifier sit several functions that generate service calls. Lead-off detection passes a very small current through the electrodes and watches the result; a broken lead wire or a dried electrode looks the same to it as a disconnected electrode. Filters shape the bandwidth: a wide diagnostic bandwidth shows the ST segment faithfully, while narrower monitoring and filter modes suppress baseline wander and muscle noise. A clinician who sees a 'different-looking' ECG between two monitors is often seeing two different filter settings. Pacemaker detection looks for the very short, fast pacing spikes and marks them, so that the heart-rate counter does not count a pacing pulse as a heartbeat.
Heart rate itself is calculated, not measured: the monitor detects QRS complexes and averages the intervals between them. Tall T-waves, noise or pacing spikes can be counted wrongly. A simulator delivers a clean, known waveform and lets you confirm that the amplitude, rate and lead-off functions behave correctly. It does not tell you how the arrhythmia algorithm performs on real, noisy patients, and you should not claim that it does.
SpO2: two colours of light and a calibration curve
A pulse oximeter sensor has light-emitting diodes on one side of the finger, earlobe or foot and a photodetector on the other. It uses two wavelengths, one in the red and one in the infrared. Oxygenated and deoxygenated haemoglobin absorb these two colours differently. Most of the light absorption is constant - skin, bone, venous blood - but with each heartbeat the arterial blood volume pulses, and the absorption changes a little. The module separates that small pulsatile part from the large constant part at each wavelength and takes the ratio between the two wavelengths.
That ratio is not converted to saturation by a physical formula. It is converted through an empirical calibration curve that each technology owner built from studies on human volunteers, using their own sensor design, LED wavelengths and processing. This is the reason SpO2 technologies are not interchangeable. A sensor from one technology plugged into a module of another may fit the connector and still give errors or wrong values, because the module expects a different sensor and a different curve.
For service, this has a direct consequence. An SpO2 simulator does not check that the monitor reads true oxygen saturation; it cannot, because there is no real blood. It presents a defined optical or electrical signal, and the monitor converts it through its own curve. The simulator must therefore be set for the correct technology and curve, and the test proves that the module and its signal path work and follow their curve. The accuracy of the curve itself was established by the manufacturer's clinical testing, not by you. Pulse rate, signal-strength indicators and alarm behaviour can all be checked on the simulator.
NIBP: an oscillometric estimate
The automatic non-invasive blood pressure channel has a pump, one or more valves, a pressure transducer and a cuff on the patient's arm or leg. The pump inflates the cuff above the point where the artery is closed, then the system releases pressure in steps or continuously. As the cuff pressure passes through the patient's arterial pressures, the pulsing artery makes small oscillations in the cuff pressure. The module records the size of these oscillations against cuff pressure.
The oscillations are largest close to the mean arterial pressure, which is the most directly measured value. Systolic and diastolic pressures are derived from the shape of the oscillation curve by the manufacturer's algorithm. Different manufacturers use different algorithms, so two healthy monitors can give slightly different results on the same patient. That is not a fault.
For service, split the NIBP channel into two parts. The first is pure physics: does the transducer read the cuff pressure correctly, does the pneumatic system hold pressure without leaking, and does the over-pressure protection release the cuff if pressure goes too high? You test these absolutely, with a calibrated manometer and a rigid test volume, in the manufacturer's service mode. The second part is the algorithm: an NIBP simulator produces repeatable oscillation patterns and lets you check that the module measures consistently and completes its cycles in a normal time. A simulator reading that differs a little from the nominal setting is usually a difference between the simulator's model and the monitor's algorithm, not a fault. The tolerances for both parts come from the manufacturer's documentation.
IBP and temperature: two resistive sensors
Invasive blood pressure is measured through a fluid-filled line from a catheter in an artery or a central vein to a disposable transducer. The transducer contains a strain-gauge bridge: four resistances arranged as a Wheatstone bridge, whose balance changes slightly with pressure. The monitor supplies an excitation voltage to the bridge and measures the small output voltage, which is proportional to both the pressure and the excitation. Disposable transducers are built to a common sensitivity, so the monitor can work with them through the correct interface cable.
Two things in IBP are purely practical and cause most complaints. The first is zeroing: the transducer must be opened to atmosphere at the level of the patient's heart and zeroed, because its offset drifts and because the height of the transducer relative to the heart adds or subtracts a column of fluid pressure. A transducer about 10 cm below heart level reads roughly 7 mmHg high. The second is the fluid line: air bubbles, clots, kinks and overly long or compliant tubing damp or distort the waveform. Neither is a monitor fault. A patient simulator replaces the transducer and presents a known bridge output, which tests the monitor channel and the interface cable, not the disposable line.
Temperature probes are usually thermistors, resistors whose value falls as temperature rises along a known curve. The monitor measures the resistance and converts it. Different probe families use different resistance curves, so a probe from the wrong family plugged into a channel will read wrong without any alarm. A simulator presents precise resistances that correspond to known temperatures and checks the conversion.
CO2 and gas modules: infrared absorption
Carbon dioxide absorbs infrared light strongly in a narrow band. A capnograph passes infrared light through a sample of the patient's breath and measures how much is absorbed at that band; more absorption means more CO2. The result is shown as a waveform and as end-tidal CO2, in mmHg, kPa or percent depending on configuration.
There are two designs. In mainstream capnography the measuring cell sits directly on the airway between the tube and the breathing circuit, and the gas is measured where it flows. In sidestream capnography a small pump draws a continuous sample from the airway through a thin sampling line to a measuring bench inside the module. Sidestream needs a water trap or a filter line to keep condensate and secretions out, and it fails in a predictable way: water or secretions block the line, the pump wears, and the module reports an occlusion. Multigas modules used in anaesthesia add infrared measurement of anaesthetic agents and nitrous oxide, and often a separate oxygen sensor.
The CO2 channel is one of the few on a monitor that you can check against a real physical reference: a certified calibration gas of known CO2 concentration, applied as the manufacturer describes. The certificate of that gas, and its expiry date, become part of your service record.
- Checked absolutely with a reference: NIBP cuff pressure (manometer), CO2 concentration (certified gas), temperature conversion (precise resistances), IBP channel gain (known bridge signal).
- Checked for consistency only: SpO2 (simulator through the module's own curve), NIBP systolic and diastolic values (simulator through the module's own algorithm), ECG analysis algorithms.
- Not checked by the engineer at all: the clinical accuracy of the SpO2 curve and the NIBP algorithm, which the manufacturer establishes by clinical studies.
The NIBP that 'read 8 high'
A ward returned a monitor because its NIBP read higher than the manual sphygmomanometer the nurses used. The engineer connected an NIBP simulator: systolic read a few mmHg above the simulator's nominal value, repeatably. A colleague suggested a recalibration. Instead, the engineer entered the service mode and compared the transducer with a calibrated manometer on a rigid test volume at several pressures: all points were well inside the manufacturer's tolerance, and the leak test passed. The same simulator setting on a second monitor of another brand gave a different, equally repeatable offset. The ward's complaint came from comparing two different methods on a patient whose arm needed a larger cuff.
Separate what you can measure absolutely (static pressure, leak) from what depends on an algorithm. Do not recalibrate a transducer that is correct to make a simulator or a manual reading agree.
On-site checklist
- For every complaint, identify the channel first, then the accessory of that channel.
- Know for each channel whether your test is absolute (reference) or consistency only (simulator through the module's algorithm).
- Set the SpO2 simulator for the technology and curve of the module under test.
- Check NIBP static pressure with a calibrated manometer before drawing any conclusion from simulator readings.
- For IBP complaints, ask about zeroing and transducer height before suspecting the monitor.
- Confirm the temperature probe family matches the channel.
- Record the certificate and expiry of any calibration gas you use.